Translate this page into:
Does Metabolic Syndrome Determine Severity and Disability of Chronic Low Backache?
This is an open access journal, and articles are distributed under the terms of the Creative Commons Attribution-NonCommercial-ShareAlike 4.0 License, which allows others to remix, tweak, and build upon the work non-commercially, as long as appropriate credit is given and the new creations are licensed under the identical terms.
This article was originally published by Medknow Publications & Media Pvt Ltd and was migrated to Scientific Scholar after the change of Publisher.
Abstract
Introduction:
Obesity may be associated with more severe and disabling low backache (LBA) due to alteration in biomechanics, but there are no such studies from developing countries.
Aims:
We report the frequency of metabolic syndrome (MS) in chronic LBA (CLBA) and its association with severity and disability of CLBA.
Subjects and Methods:
Consecutive patients with CLBA attending to the neurology service from October 2015 to February 2016 were included in the study. Clinical and demographic parameters were recorded. Routine biochemical test was done. The severity of pain was assessed by a 0–10 Numeric Rating Scale (NRS) and disability by Oswestry Disability Index (ODI) version 2. Comparison of variables was done by Chi-square or independent t-test and correlation by Karl Pearson or Spearman's rank correlation test.
Results:
Seventy-none (39.3%) patients had MS as per the International Diabetic Federation (IDF) criteria and 68 (33.8%) as per the National Cholesterol Education Program Adult Treatment Panel III criteria. Abdominal obesity was the most common (171 [85.1%]) feature of MS. The patients with MS had longer duration of sitting work and did less frequently exercise. The NRS score (6.95 ± 1.06 vs. 6.65 ± 0.95; P = 0.04) and ODI score (54.91 ± 8.42 vs. 51.89 ± 8.54; P = 0.01) were higher in CLBA patients with MS compared to those without MS.
Conclusion:
About 40% patients with CLBA have metabolic syndrome, and they have more severe pain and disability.
Keywords
Backache
chronic low backache
disability
metabolic syndrome
Numeric Rating Scale
obesity
severity

INTRODUCTION
Low backache (LBA) is a common medical disorder, and 60%–80% of adults develop LBA sometime in their lifetime. It is the fifth most common cause to visit physician in the USA.[12] Chronic LBA (CLBA) is considered if continuous or fluctuating LBA continues for >3 months.[3] Patients with CLBA visit family physician, orthopedists or physical therapists, or chiropractors for pain relief. These patients should be evaluated with the aim of categorizing into nonspecific backache, backache associated with radiculopathy or spinal stenosis, back pain referred from a nonspinal source, or back pain associated with another specific spinal cause. Majority of patients with CLBA have musculoskeletal disorders. In a population-based study, 41% reported LBA; of them, 43% were women and 37% were men. Higher body mass index (BMI), reduced physical activity during leisure time along with heavy physical workload, lower education level, and living in a smaller community are the predictors of CLBA.[45] In general population, the monthly prevalence of LBA is 30% and 40%, and annual prevalence is 25%–60%.[67] The annual prevalence of CLBA is 10–13%.[89] Population-based studies and meta-analysis have reported association of LBA with BMI or weight.[1011] Higher BMI in CLBA may be a cause or effect of pain. Pain may limit mobility resulting in obesity in the one hand, and obesity may alter the biomechanics of the spine leading to misplacement of center of gravity. Moreover, metabolic syndrome (MS) may result in atherosclerotic changes of arterioles supplying vertebrae which may enhance osteoporosis. The alteration of biomechanics of the spine may aggravate severity of CLBA and thereby disability. In the medical literature, there is no study evaluating the role of MS in determining the severity and disability of CLBA. We, therefore, compare the demographic, clinical severity of pain and disability in the CLBA patients and compare these parameters in those with MS and without MS.
METHODS
Consecutive patients with CLBA attending to the neurology outpatient service from October 2015 to February 2016 were included in the study. The study was approved by the Institutional Ethics Committee (IEC code: 2015-93-IP-EXP, PGI/BE/563/2015). Sample size calculation was done by considering population size of 12000 with expected frequency of 25%, confidence limit of 5%, and single design effect. The estimated sample was 200 patients.
Inclusion criteria
The patients were diagnosed to have CLBA if the LBA lasted for >3 months.
Exclusion criteria
Children (<18 years), pregnant mother, and those patients with CLBA due to specific cause (trauma, infection, collagen vascular disease, seronegative or seropositive arthritis, postspinal surgery, endocrine disorder, or malignancy) were excluded from the study. The patients who had organ transplantation on immunosuppressant, corticosteroid, anticancer drug or those with major psychiatric diseases were also excluded from the study.
Clinical evaluation
The demographic details (age, gender, residence, education, and employment) of the patients were recorded. Their lifestyle, smoking, tobacco chewing, and dietary habit were noted. The duration of illness was noted and patients were enquired about location and radiation of pain, aggravating and relieving factors, weakness, sensory impairment, and bladder symptoms. General physical and neurological examination findings were noted. The presence of pain during straight leg raising was recorded. Muscle power, sensation, and reflexes were noted.
The severity of pain was assessed by a 0–10 Numeric Rating Scale (NRS)[12] and disability by Oswestry Disability Index (ODI) version 2.[13] The disability (ODI) was categorized as minimal (0–20%), moderate (21–40%), severe (41–60%), crippled (61–80%), and bed bound (81–100%).[14]
Investigations
Blood counts, erythrocyte sedimentation rate, hemoglobin, fasting and postprandial blood sugar, serum creatinine, sodium, potassium, bilirubin, calcium, alkaline phosphatase, transaminases, and fasting lipid profile were measured. Thyroid function test and 25-hydroxy Vitamin D levels were also done. Patients with localized vertebral tenderness and neurological deficit underwent lumbosacral magnetic resonance imaging (MRI) study on a 3T MRI machine (Signa, GE Medical System, Wisconsin, USA). Bone mineral density (BMD) was done using Hologic Osteoporosis Management Machine Discovery QDR Series (Hologic, Inc., MA, USA), and t-score of lumbar vertebrae was noted.
Metabolic syndrome
Diagnosis of MS was based on the National Cholesterol Education Program Adult Treatment Panel III[15] (NCEP ATP III) and International Diabetic Federation (IDF) criteria.[16] According to the NCEP III criteria, three of the following features were needed including central obesity.
-
Central obesity: Waist circumference >102 cm in males and >88 cm in females
-
Hypertriglyceridemia: >150 mg/dl or on specific medication
-
Low high-density lipoprotein (HDL): <40 mg/dl in males and <50 mg/dl in females
-
Blood pressure: >130 mmHg systolic or >85 mmHg diastolic blood pressure or on antihypertensive drugs
-
Fasting plasma glucose: >100 mg/dl or on specific medication or previously diagnosed type 2 diabetes
-
The features of IDF criteria are similar to the NCEP III except (A) – abdominal circumference >90 cm in males and >80 cm in females. In the IDF criteria, the patients should fulfill the abdominal circumference criteria along with 2 or more other features of MS.[16]
BMI was calculated by dividing weight in kilogram by height in meter.[2] The patients were categorized as overweight if BMI was >25–29.9, obese if 30–34.9, and morbidly obese if >35.[17] Anxiety and depression were assessed using the Hamilton Anxiety and Depression Scale (HADS).
Statistical analysis
The demographic, clinical finding, NRS score, and ODI were compared between the patients with and without MS using parametric for continuous and nonparametric for the categorical variables. The NRS and ODI scores were correlated with various components of MS and number of MS in a given patient using Karl Pearson or Spearman's rank correlation test. A variable having a two-tailed P < 0.05 was considered significant. Statistical analysis was done using SPSS version 20 (IBM-SPSS, Armonk, IBM, Chicago, New York).
RESULTS
There were 201 patients with CLBA, whose age ranged between 18 and 72 (median 43) years. One hundred and nine (54.2%) patients were above the age of 40 years and females outnumbered males (138 [68.7%] vs. 63 [31.3%]). Ninety-six (47.8%) patients were vegetarian. Seventy-four (36.8%) patients were mild to moderately active; 72 (35.8%) did morning walk, and 33 (16.4%) did other form of physical activity. One hundred and eighty-seven (93%) patients did >3 h sitting work. The patients were symptomatic for a median duration of 36 (range: 3–240) months and 81 (40.3%) were symptomatic for >3 years. The pain was severe (NRS score: 7–10) in 112 (55.7%), moderate (NRS score: 4–6) in 88 (43.8%), and mild in 1 (0.5%) patient. The ODI score ranged between 24 and 90 (median 54), moderate disability in 19 (10%), severe in 152 (75.1%), crippled in 29 (14.4%), and bedridden in 1 (0.5%) patient. Comorbidities were present in 54 (26.9%) patients; 21 (10.4%) were hypertensive, 35 (17.4%) were diabetic, and 10 (5%) were hypothyroid. BMI ranged between 16 and 37 (median: 24.8) and was high in 98 (48.8%) patients; 71 (35.3%) overweight and 27 (13.4%) obese. Three (1.5%) patients were morbidly obese.
Metabolic syndrome
Seventy-nine (39.3%) patients had MS according to the IDF criteria and 68 (33.8%) had MS as per the NCEP ATP III criteria. According to the IDF criteria, high blood pressure was present in 32 (40.5%), increased abdominal circumference in 79 (100%), high fasting blood sugar in 33 (41.8%), high triglyceride in 54 (68.4%), and low HDL in 67 (84.8%) patients [Figure 1a and b]. The number of risk factors for MS as per the IDF criteria included 3 factors in 53, 4 in 17, and 5 in 9 patients [Figure 2]. The CLBA patients with MS was older (46.9 ± 10.5 vs. 41 ± 11.1 years; P < 0.001) and did insignificantly longer duration of sitting (>3 h) work (76 [96.2%] vs. 111 [91%]; P = 0.15). Lesser number of CLBA patients with MS did regular morning walk (27.8% vs. 41%; P = 0.06) and other exercise (12.7% vs. 18.9%; P = 0.24). There were, however, no differences in gender, education, lifestyle, dietary habit, HADS score, and serum calcium, alkaline phosphatase, phosphorus, albumin, and Vitamin D levels. The details are presented in Tables 1 and 2.
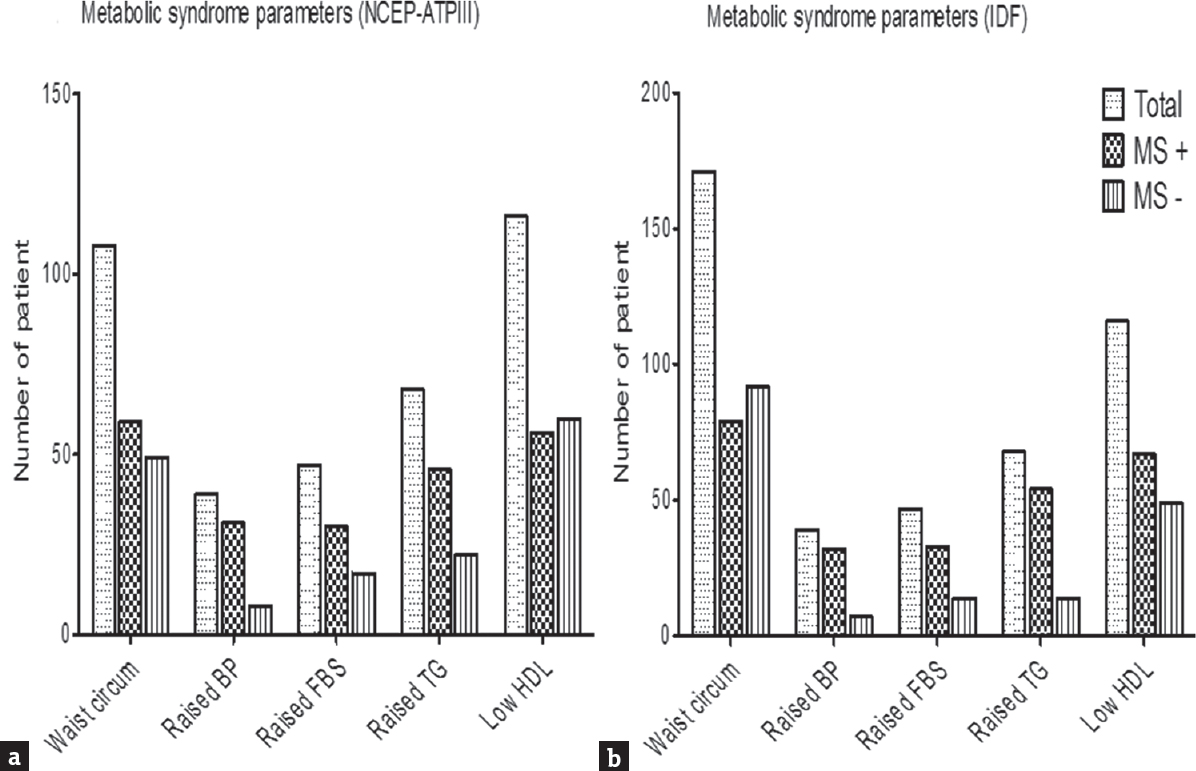
- Individual features of metabolic syndrome in chronic low backache as per (a) National Cholesterol Education Program Adult Treatment Panel III and (b) Indian Diabetic Federation (IDF). Higher number of patients had metabolic syndrome as per the IDF criteria compared to the National Cholesterol Education Program Adult Treatment Panel III criteria (39.3% vs. 33.8%), as in the IDF criteria, abdominal circumference is essential criteria for the diagnosis of metabolic syndrome with a lower cutoff (90 cm)

- Bar diagram showing number risk factors of metabolic syndrome as per Indian Diabetic Federation (IDF) criteria. Nearly 39.4% of patients fulfilled the criteria of metabolic syndrome (>2 criteria). Only 5.5% of patients did not have any features of metabolic syndrome and about 55.2% of patients had either one or two features of metabolic syndrome


The duration of illness was comparable between the patients with and without MS (49.9 ± 48.7 vs. 48.2 ± 47.72 months; P = 0.80). The number of patients with localized (21.5% vs. 27.9%) and radicular pain (78.5% vs. 72.1%; P = 0.31) was also similar between the two groups. On BMD study, the number of patients with lower t-score was not significantly different between the patients with and without MS (62% vs. 53.3%; P = 0.22). The MRI evidences of degenerative disc changes were also similar between the two groups [Table 2]. The severity assessed by NRS score (6.95 ± 1.06 vs. 6.65 ± 0.95; P = 0.04) and disability by ODI (54.91 ± 8.43 vs. 51.89 ± 8.55; P = 0.01) significantly higher in the patients with MS compared to those without MS [Figure 3].

- Error bar shows more severe pain on Numeric Rating scale score and disability on Oswestry Disability Index in the patients with chronic low backache with metabolic syndrome compared to those without metabolic syndrome
DISCUSSION
In the present study, 39.3% of patients with CLBA had MS and the patients with MS had more severe pain and disability compared to those without MS. The patients with MS were older and did lesser physical activity and longer duration of sitting work. This study for the first time evaluated the frequency of MS in CLBA and its relationship with pain severity and disability. The relationship of increasing age with MS may be due to distribution of MS in the age-specific population. Several population-based studies have reported an increasing prevalence of MS with age regardless of definition,[1819] and some studies have reported a peak prevalence in the seventh decade and then a decline in both genders[2021] or only in men.[22] The prevalence of MS in the USA has been reported in 22% (24% after age adjustment).[20] The prevalence increases with increasing age from 18.3% among those 20 to 39 years of age to 46.7% among those 60 years or older.[22] The prevalence of MS is increasing in India, both in the urban and rural areas ranging from 11% to 41%.[23242526] The differences in the prevalence of MS between studies from Indian subcontinent may be attributed to different criteria employed, different age groups as well as socioeconomic and food habits. Higher frequency of CLBA has been reported in older population, and they are likely to have diabetes, hypertension, hyperlipidemia, and obesity. This may explain the higher frequency of MS in elderly with comorbidities in our study.
In the present study, BMI was higher in 48.8% of patients with MS, and 1.5% of patients were morbidly obese. In a study on 60 patients with CLBA, the MS was present in 25% of patients and was related to older age and higher BMI.[27] This study, however, did not correlate MS with severity of pain and disability. In our study, majority of patients had severe disability, 151 (75.1%). Ours being a tertiary referral neurology setup, the milder cases with less severe pain may not have referred to us as well as more severe illness might have referred to neurosurgery. Only 1 patient was bedridden although almost all had evidence of disc prolapse at various levels of lumbosacral region. The significant difference in lipid profile, fasting blood sugar, or BMI in the group of CLBA patients with MS is self-explanatory. These biochemical changes, however, were not reflected with hemoglobin, serum albumin, calcium, alkaline phosphatase, phosphorus, and BMD. The hypothesis of abdominal obesity resulting in alteration in biomechanics and degenerative changes of the lumbosacral spine is not observed in our study. Abnormal lipid profile and blood sugar may enhance lipohyalinosis of capillaries, which may result in osteopenia, osteoporotic fracture, and pain. The larger population-based longitudinal study is needed to evaluate these phenomena. In a study, migraineurs with MS and obesity had more severe and frequent headache.[28] In our earlier study on migraine, MS and insulin resistance, however, were not related to severity and frequency of headache.[29] In the present study, 85.1% of patients had abdominal circumference above the range, but 39.3% of them fulfilled the other criteria of MS. This may be due to variation in fat deposition in Indians. A study on fat distribution revealed that the level of fatness expressed in whatever form increased with age till the sixth decade of life and declined thereafter along with a redistribution of fat resulting in more android pattern of fatness in female. The shift from gynoid to android fat distribution with increasing age occurs, especially after menopause.[30]
Limitation
This study is limited by lack of longitudinal follow-up and effect of BMI reduction on severity and disability of CLBA.
CONCLUSION
About two-fifth patients with CLBA have MS and patients with MS have more severe pain and disability. Further population-based longitudinal study is needed to evaluate the effect of MS and its reversal in the outcome of CLBA.
Financial support and sponsorship
Nil.
Conflicts of interest
There are no conflicts of interest.
Acknowledgment
We would like to thank Mr. Shakti Kumar for secretarial help.
REFERENCES
- Physician office visits for low back pain. Frequency, clinical evaluation, and treatment patterns from a U.S. national survey. Spine (Phila Pa 1976). 1995;20:11-9.
- [Google Scholar]
- Back pain prevalence and visit rates: Estimates from U.S. national surveys, 2002. Spine (Phila Pa 1976). 2006;31:2724-7.
- [Google Scholar]
- Medical Management of Acute and Chronic Low Back Pain: An Evidence-Based Approach. Amsterdam: Elsevier; 2002. p. :27-40.
- Estimating the prevalence of low back pain in the general population.Evidence from the South Manchester back pain survey. Spine (Phila Pa 1976). 1995;20:1889-94.
- [Google Scholar]
- Prevalence and consequences of low back problems in the Netherlands, working vs. non-working population, the MORGEN-study. Monitoring project on risk factors for chronic disease. Public Health. 1999;113:73-7.
- [Google Scholar]
- Epidemiology of chronic musculoskeletal pain. Best Pract Res Clin Rheumatol. 2007;21:403-25.
- [Google Scholar]
- The prevalence of low back pain in Africa: A systematic review. BMC Musculoskelet Disord. 2007;8:105.
- [Google Scholar]
- The prevalence of low back pain and risk factors among adult population in Afyon region, Turkey. Acta Orthop Traumatol Turc. 2008;42:328-33.
- [Google Scholar]
- The association between obesity and low back pain: A meta-analysis. Am J Epidemiol. 2010;171:135-54.
- [Google Scholar]
- Body mass index as a risk factor for developing chronic low back pain: A follow-up in the nord-trøndelag health study. Spine (Phila Pa 1976). 2013;38:133-9.
- [Google Scholar]
- Pain: A review of three commonly used pain rating scales. J Clin Nurs. 2005;14:798-804.
- [Google Scholar]
- An open labeled randomized controlled trial of pregabalin versus amitriptyline in chronic low backache. J Neurol Sci. 2014;342:127-32.
- [Google Scholar]
- National Cholesterol Education Program (NCEP) Expert Panel on Detection, Evaluation, and Treatment of High Blood Cholesterol in Adults (Adult Treatment Panel III). Third report of the national cholesterol education program (NCEP) expert panel on detection, evaluation, and treatment of high blood cholesterol in adults (Adult treatment panel III) final report. Circulation. 2002;106:3143-421.
- [Google Scholar]
- Persistent increase of prevalence of metabolic syndrome among U.S. Adults: NHANES III to NHANES 1999-2006. Diabetes Care. 2011;34:216-9.
- [Google Scholar]
- Increased prevalence of metabolic syndrome in individuals with osteoarthritis: An analysis of NHANES III data. Postgrad Med. 2009;121:9-20.
- [Google Scholar]
- Prevalence of the metabolic syndrome among US adults: Findings from the Third National Health and Nutrition Examination Survey. JAMA. 2002;287:356-9.
- [Google Scholar]
- The metabolic syndrome: prevalence and associated risk factor findings in the US population from the Third National Health and Nutrition Examination Survey, 1988-1994. Arch Intern Med. 2003;163:427-36.
- [Google Scholar]
- Prevalence of the metabolic syndrome in the United States, 2003-2012. JAMA. 2015;313:1973-4.
- [Google Scholar]
- Obesity and the metabolic syndrome in developing countries. J Clin Endocrinol Metab. 2008;93:S9-30.
- [Google Scholar]
- Prevalence of dyslipidemia in urban and rural India: The ICMR-INDIAB study. PLoS One. 2014;9:e96808.
- [Google Scholar]
- Prevalence of insulin resistance syndrome in a selected south Indian population – The Chennai urban population study-7 [CUPS-7] Indian J Med Res. 2002;115:118-27.
- [Google Scholar]
- Metabolic syndrome in urban Asian Indian adults – A population study using modified ATP III criteria. Diabetes Res Clin Pract. 2003;60:199-204.
- [Google Scholar]
- Evaluation of metabolic syndrome in patients with chronic low back pain. Rheumatol Int. 2012;32:663-7.
- [Google Scholar]
- Metabolic syndrome and insulin resistance in migraine. J Headache Pain. 2012;13:321-6.
- [Google Scholar]
- Body composition and fat distribution pattern of urban elderly females, Delhi, India. Coll Antropol. 2005;29:493-8.
- [Google Scholar]