Translate this page into:
Value of Minimum Apparent Diffusion Coefficient on Magnetic Resonance Imaging as a Biomarker for Predicting Progression of Disease Following Surgery and Radiotherapy in Glial Tumors from a Tertiary Care Center in Northern India
This is an open access article distributed under the terms of the Creative Commons Attribution-NonCommercial-ShareAlike 3.0 License, which allows others to remix, tweak, and build upon the work non-commercially, as long as the author is credited and the new creations are licensed under the identical terms.
This article was originally published by Medknow Publications & Media Pvt Ltd and was migrated to Scientific Scholar after the change of Publisher.
Abstract
Purpose:
Studies have shown that cellularity of glial tumors are inversely correlated to minimum apparent diffusion coefficient (ADC) values derived on diffusion-weighted imaging (DWI). The purpose of this prospective exploratory study was to evaluate whether temporal change in “minimum ADC” values during follow-up predict progressive disease in glial tumors post radiotherapy and surgery.
Materials and Methods:
Adult patients of glial tumors, subjected to surgery followed by Radiotherapy (RT), were included in the study. Serial conventional magnetic resonance imaging with DWI at the following time points – presurgery, pre-RT, post-RT imaging at 3, 7, and 15 months were done. For “minimum ADC” values, multiple regions of interest (ROI) were identified on ADC maps derived from DWI. A mean of 5 minimum ADC values was chosen as “minimum ADC” value. The correlation was drawn between histology and minimum ADC values and time trends were studied.
Results:
Fourteen patients were included in this study. Histologies were low-grade glioma (LGG) – 5, anaplastic oligodendroglioma (ODG) -5, and glioblastoma multiforme (GBM) – 4. Minimum ADC values were significantly higher in LGG and GBM than ODG. Presurgery, the values were 0.812, 0.633, and 0.787 × 10⁻³ mm2/s for LGG, ODG, and GBM, respectively. DWI done at the time of RT planning showed values of 0.786, 0.636, 0.869 × 10⁻³ mm2/s, respectively. During follow-up, the increasing trend of minimum ADC was observed in LGG (P = 0.02). All these patients were clinically and radiologically stable. Anaplastic ODGs, however, showed an initial increase followed by the fall of minimum ADC in all the 5 cases (P = 0.00). Four of the five cases developed progressive disease subsequently. In all the 4 GBM cases, a consistent fall of minimum ADC values was observed (P = 0.00), and they all progressed in spite of RT.
Conclusions:
The DWI-derived minimum ADC values are an important yet simple quantitative tool to assess the treatment response and disease progression before they are evident on conventional imaging during the follow-up of glial tumors.
Keywords
Apparent diffusion coefficient
diffusion-weighted imaging
glioma
radiotherapy

INTRODUCTION
Central nervous system tumors comprise 1%–2% of all malignancies.[1] According to the Indian Council for Medical Research-2009 Cancer Registry report, glioma incidence in India is 5.8% in Mumbai, 6.7% in Bengaluru, 3.5% in Chennai, 5.6% in Dibrugarh, and 28.2% in Trivandrum among males and 6.3% in Mumbai, 5.6% in Bengaluru, 7.5% in Chennai, 0% in Dibrugarh, and 21.8% in Trivandrum among females.[2]
The treatment of glial tumor is multimodal. The general principal includes maximal surgical resection followed by adjuvant radiotherapy with or without chemotherapy depending upon the grade of tumor.[345] However, there is inherent difficulty with response assessment and injury of normal tissue following radiotherapy in the glial tumors, where tumor cannot always be distinguished from associated edema and normal irradiated tissue. Using T1-weighted, T2-weighted, and proton density-weighted imaging, changes during or in the short-term (up to 15 months) are not always apparent in the normal brain that gets irradiated in the trajectory of radiation beams, even though doses as high as 60–65 Gy in 6 weeks are delivered.[6] Conventional magnetic resonance imaging (MRI) alone is often not able to provide an early indication of the effectiveness of radiation therapy, chemotherapy, and/or targeted therapies. Sophisticated imaging techniques such as functional MRI imaging (e.g., MR spectroscopy, diffusion, and perfusion imaging) or positron emission tomography (PET) using amino acid traces, therefore, have been explored.[7]
Diffusion magnetic resonance imaging and apparent diffusion coefficient
Diffusion-weighted MR imaging (DW-MRI) interrogates tissue architecture using the information on random (Brownian) motion of water molecules in tissues. Water movement in tissues is not entirely random as it is modified by flow within blood vessels and ducts and by interactions with components that restrict water diffusions such as hydrophobic phospholipid-containing cellular membranes, intracellular organelles, and macromolecules.
In vivo, intracellular and extracellular compartments will have their own unique water diffusion constants, which are measured in mm2/s. The measured diffusion coefficient of water in the brain is around 1 × 10⁻³ mm2/s. The average water displacements are usually much greater than the diameter of a cell; therefore, water diffusion in tissues is not unrestricted but attenuated. The measured diffusion in tissues is termed as apparent diffusion coefficient (ADC).[8]
With increasing tumor cellularity and architectural distortion, any increase in the tortuosity of the extracellular space will additionally contribute to decreased ADC values. Any process that causes ischemia, necrosis or cellular lysis will lead to increases in water diffusion corresponding to increases in ADC values. The measured ADC is, therefore, inversely related to the cellularity of tumors and grade.[9101112] Studies in the patients with glial tumors have shown inverse correlations between ADC values and tumor cellularity and grade, with high-grade gliomas having significantly lower ADC values than low-grade gliomas.[13] Cell proliferation has also been correlated with ADC value; Higano et al. noted a significant inverse correlation between ADC value and the Ki67 labeling index in 37 patients with glioma (r = −0.562; P < 0.001).[12] Radiologists have also used increased tumor cellularity as a biomarker of malignancy using ADC value in DW imaging (DWI) to discriminate between benign and malignant disease in a variety of other organs such as liver, pancreas, prostate, retroperitoneum, ovary, breast, and the head and neck. These studies have shown that malignant lesions have significantly lower ADC values than normal tissues or benign lesions.[1415161718192021]
Low ADC values are used as indicators for high-grade gliomas and correlate with poor survival in malignant astrocytomas independent of tumor grade.[1112] Several studies have also demonstrated that DWI is a sensitive and early indicator of both treatment response and overall survival in brain tumors.[2223242526]
Although conventional MRI is available in most cities of India, centers routinely using functional imaging are less. In the clinical setting, there are very few studies from India using DWI and ADC as a biomarker in tumors of the brain and cervical cancer.[2728293031] With this view in mind, we wanted to test the utility of a simple, functional study parameter which can be easily done along with conventional MRI at a larger scale at the national level to predict progression of disease in glial tumors post treatment. With a view to refine assessment of tumor status during follow-up after radiotherapy and surgery of glial tumors, we studied the role of ADC for predicting tumor response in patients. The purpose of this study was to evaluate whether changes in “minimum ADC” values of glial tumors of the brain following RT can help in predicting progression of disease in the context of conventional imaging and clinical status of the patients.
MATERIALS AND METHODS
This pilot prospective study was conducted after approval from the Institutional Ethical Committee and patient consent was taken.
Patients
Following initial surgery, patients were referred from the Department of Neurosurgery to the Department of Radiotherapy between October 2008 and October 2010. Their demographic profiles were recorded.
Inclusion criteria
Adult patients (18–70 years); who had histological proof of glial tumors of brain having WHO low-grade glioma (LGG Grade II), that is, astrocytoma, oligoastrocytoma or oligodendroglioma [ODG]) and high-grade glioma (HGG), that is, anaplastic ODG (WHO Grade III) and glioblastoma multiforme (GBM) (WHO Grade IV), who had received RT but no chemotherapy (temozolomide/bevacizumab) and any other anti-cancer treatment due to cost concerns and other logistic reasons and to rule out the confounding factor like pseudoprogression and pseudoprogression.
Exclusion criteria
Patients having age <18 years and >70 years; LGG where no histological proof was available; anaplastic ODG/GBM patients who received concurrent/adjuvant temozolomide/chemotherapy.
Radiotherapy planning, treatment, and delivery
Patients were immobilized in a U type thermoplastic cast, and contrast-enhanced computed tomography (CECT) scan of the brain was done with 3 mm slice thickness after placement of fiducial markers. Postsurgery, patients, underwent an MRI scan on a 3T scanner. CECT Radiotherapy planning scan was co-registered with the postsurgery MRI images using the fusion software on the TPS (Eclipse version 8.0, Varian Medical Systems, Palo Alto, CA).
Target delineation was performed on the fluid-attenuated inversion recovery (FLAIR) images in LGG and T1-weighted contrast images in HGG. Clinical target volume (CTV) was generated from gross tumor volume in three-dimensional (3-D) by a 1 cm expansion for LGG and a 2 cm expansion for HGG with appropriate editing for anatomical barriers to tumor spread. The planning target volume was generated from the CTV by a 0.5 cm expansion in 3-D. RT to a dose of 54 Gy/30 fr/6 weeks for LGG and 59.4 Gy/33 fr/61/2 weeks for anaplastic ODG was prescribed to the PTV. GBM patients received 60 Gy/30 fr/6 weeks to the PTV. RT was delivered conventionally or conformally with 2–3 coplanar beams, using 0.5 cm or 1 cm multileaf collimator leaves on a 6 MV linear accelerator. The 95% isodose line aimed to cover the PTV in all cases and dose heterogeneity within the PTV was restricted to −5% to +7% of the prescribed dose as per ICRU-50.
Follow-up program and serial magnetic resonance imaging
Patients were evaluated clinically along with serial conventional MRI along with DWI at the following time points – presurgery, pre-RT planning, post-RT baseline imaging at 3 months and 1–2 imaging later at 7 and 15 months or at the clinical suspicion of progression.
On conventional MRI, assessment of size and the response was made by using McDonald's criteria and modified RANO criteria.[3233] In addition, changes in size of contrast-enhancing area or appearance of new contrast-enhancing lesions were noted.
Magnetic resonance acquisition and data processing
The MR imaging was performed on a 3.0 Tesla MRI scanner (General Electric Medical System, Milwaukee, WI) by using a standard 8 channel head coil. The MRI study included fast spin echo T2, T2 FLAIR, DWI pre- and post-contrast T1 FLAIR using gadolinium diethylenetriamine penta-acetic acid (Gd-DTPA; Schering, Germany) at a dose of 0.1 mmol/kg body weight. The common parameters used for all of the pulse sequences were field-of-view = 24, slice thickness = 3 mm with no interslice gap.
Apparent diffusion coefficient calculation
DW-MRI data were used to compute ADC values. ADC maps were generated on a pixel-by-pixel basis using formula:
ADC = b−1 ln (S0/S)
Where S0 and S represent the signal intensities of the image without and with DW gradients, and b (diffusion weighting factor) was 1000 s/mm2 in our study and S0 is map obtained with b = 0 and S is with b = 1000 s/mm2. Before calculation of ADC maps, an automatic de-scalping method was used for discarding the nonbrain portions.[34] The calculated ADC maps were analyzed by using ImageJ image processing software (https://imagej.nih.gov/ij/) – screen captures as shown in Figure 1.[35] Regions of interests (ROIs) using a square of 16 mm2 within the tumor area were drawn manually onto the obtained ADC maps corresponding to the solid enhancing portions/relevant portions on a T1-weighted or FLAIR images of the lesion. For normalization, in each patient, ROIs were also drawn in the normal-appearing contralateral hemisphere. A mean of the 5 lowest minimum ADC values was determined on each image set which was chosen as “minimum ADC” value for that image set. All the quantitative analysis was performed under the guidance of experienced neuroradiologist.
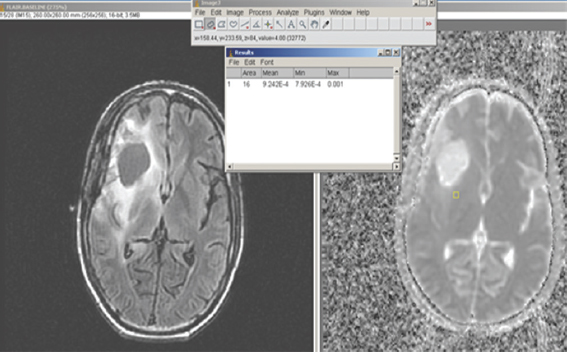
- Placement of region of interest seen as a small rectangle in the apparent diffusion coefficient map (right panel) in an area that corresponds to the bright signal in the tumor seen on the fluid-attenuated inversion recovery image in a low-grade glioma (left panel). The value is read off from the ImageJ software, top
Statistical considerations
The correlation was drawn between histology and “minimum ADC” values, and time trends were studied. ADC data were summarized using means and standard deviations (SDs) and statistical significance of the difference between the mean of the minimum ADC, that is, “minimum ADC” are reported using the t-test or analysis of variance (ANOVA) using Statistical Package for the Social Sciences (SPSS) version 21 software. (IBM SPSS predictive analytics software). Since this was an exploratory study, designed to see the feasibility of using DWI to see an association between ADC and the clinical profile, a sample size of convenience was taken as there was no a priori hypothesis of a difference in outcomes.
RESULTS
The data included 5 patients of LGG (median age 43 years), whereas there were 9 patients of HGG (median age 45 years, 5 with anaplastic ODG and 4 of GBM). Patients with LGG presented with symptoms at a median duration of 57 months compared to those with a median of 30 months in anaplastic ODG and 4 months in GBM [Table 1].

Following RT, the baseline scans took place at a median duration of 3 months for all the patients, while the first follow scan was done at a median of 7 months and the second follow up scan at a median of 15 months. The patients with LGG have been followed up for a median of 35 months (range 19–61), and all are stable; those with an anaplastic ODG had a median of 24 months (range 22–53) with 4 out of 5 having progressive disease and those with a GBM had a median follow-up of 11 months (range 7–18) and all have progressive disease.
The first comparison was made for the “minimum ADC” values, presurgery for the three tumor types, Figure 2. The values of “minimum ADC” were highest for LGG, followed by GBM and lowest for was the anaplastic ODG (0.812, 0.787 and 0.633 × 10⁻³ mm2/s) ANOVA P = 0.023.

- Average of the minimum apparent diffusion coefficient values of low-grade glioma, anaplastic oligodendroglioma and glioblastoma before any surgery
The next comparison was made for the three tumor types by measuring the “minimum ADC” values in the RT planning MRI scans postsurgery [Figure 3]. The values of “minimum ADC” were highest for GBM, followed by LGG and the least was seen in the anaplastic ODG, (0.786, 0.869, 0.636 × 10⁻³ mm2/s) ANOVA P = 0.000. The value of “minimum ADC” of anaplastic ODG was significantly lower than that of both LGG and GBM, but there was no significant difference between LGG and GBM (t-test P = 0.102) [Figure 3]. Temporal changes in the “minimum ADC” values following RT were determined for LGG [Figure 4], anaplastic ODG [Figure 5] and GBM [Figure 6].

- Average of the minimum apparent diffusion coefficient values of low-grade glioma, anaplastic oligodendroglioma and glioblastoma following surgery, but before RT

- Temporal changes in apparent diffusion coefficient following RT for low-grade glioma (n = 5)

- Temporal changes in apparent diffusion coefficient following RT for anaplastic oligodendroglioma (n = 5)

- Temporal changes in apparent diffusion coefficient following RT for glioblastoma (n = 4)
For the 5 patients with LGG, at 3 months following RT, the “minimum ADC” values increased significantly and continued to increase further at first and second follow-up imaging, done at a median time of 7 and 15 months. (0.786, 0.856, 0.931 × 10⁻³ mm2/s) ANOVA P = 0.023. All the patients were stable, both radiologically and clinically and remain so at a median of 35 months (range 19–61), Figure 7. A case study is illustrated in Figure 7. For the 5 patients with anaplastic ODG, at 3 months following RT, the “minimum ADC” values increased significantly and then decreased at first follow-up imaging, done at a median time of 6 months (0.636,0.806,0.725 × 10−3 mm2/s) ANOVA P = 0.000 [Figure 5]. In 3 patients, the disease was radiologically stable, but the “minimum ADC” values had clearly declined, suggesting a recurrence/re-growth. Eventually, 4 of the 5 patients including those 3 with decreasing “minimum ADC” deteriorated clinically at a median of 24 months (range 22–53). A case study illustrating discrepant findings between conventional radiology and ADC [Figure 8] and another with concordant findings [Figure 9] are shown.

- Serial imaging of a low-grade glioma, clinically and radiologically stable following RT and has an increasing apparent diffusion coefficient

- Serial imaging of an anaplastic oligodendroglioma clinically progressed but radiologically stable following RT and has a decreasing apparent diffusion coefficient

- Serial imaging of an anaplastic oligodendroglioma, clinically and radiologically stable following RT and has an increasing apparent diffusion coefficient
For the 4 patients with GBM, at 2 months following RT, the “minimum ADC” values decreased significantly and then decreased further at first follow-up imaging, done at a median time of 7 months (0.869,0.710,0.699 × 10−3 mm2/s) ANOVA P = 0.000 [Figure 6]. All patients deteriorated clinically and radiologically at a median of 11 months (range 7–18). A case study illustrating concordant findings between conventional radiology and ADC is illustrated [Figure 10].

- Serial imaging of a glioblastoma, clinically and radiologically progressing (based on pattern of enhancement, but not size) following RT and has a decreasing apparent diffusion coefficient
A comparative representation of the serial temporal changes following RT in the “minimum ADC “values for LGG along with anaplastic ODG and GBM is shown in Figure 11 and Table 2. The serial minimum ADC values rose for LGG following RT, rose initially and then fell in the patients with anaplastic ODG and consistently fell in the patients with GBM.

- Minimum apparent diffusion coefficient of low-grade glioma along with anaplastic oligodendroglioma and glioblastoma

DISCUSSION
Rationale for using the 'minimum' ADC as metric.
ADC values can be represented as the minimum, the maximum, mean, the difference between minimum and maximum, and ratios with the contralateral white matter. The choice of using the “minimum ADC” was based on the clinical studies evaluating the relationship between ADC values and tumor cellularity. In a study of 20 patients with glioma, Sugahara et al., showed inverse correlations between ADC values and tumor cellularity and grade, with HGG having significantly lower ADC values than LGG. Anaplastic ODG exhibited low ADC, but the values were found to be greater than GBM. The “minimum ADC” values of HGG varied from 0.82 to 2.46 (mean 1.2, SD 0.5) × 10−3 mm2/s while that for LGG varied from 1.94 to 3.31 (mean 2.7, SD 0.7) × 10−3 mm2/s and showed inverse correlations between ADC values and tumor cellularity and grade.[11]
With increasing tumor cellularity and architectural distortion, any increase in the tortuosity of the extracellular space will additionally contribute to decreased ADC values. It would, therefore, be expected that ADC values would correlate with tumor cellularity and grade. Cell density is not, however, the only histological factor that determines tumor grade; DWI cannot depict other histological features such as nuclear atypia, which can account for imperfect correlations. Another factor that can confound the association between ADC value and cellularity is necrosis; necrosis is an intrinsic component of poorly differentiated tumor and increases ADC values.
In the present study, the “minimum ADC” values of LGG were significantly higher than anaplastic ODG but similar to those with GBM patients, when assessed both before surgery (0.812, 0.633 and 0.787 × 10⁻³ mm2/s) and following surgery at the time of radiotherapy planning MR study (0.786, 0.636, 0.869 × 10⁻³ mm2/s), respectively. While the lower value of “minimum ADC” of anaplastic ODG compared to LGG could be explained on the basis of higher cellularity, the apparently aberrant finding of a higher value of “minimum ADC” in what should be a more cellular tumor, that is, GBM merited an explanation. One explanation could be the placement of ROIs in the regions of necrosis and therefore explained the higher “minimum ADC” values as it was learning exercise for us. But care was taken to minimize this error when determining the minimum ADC drawn on ADC map.
Studies indicate that change in ADC values occur early after starting therapy and such increase in ADC values might not be sustained because of the removal of apoptotic cells and the onset of fibrosis.[36] Numerous studies by Chenevert et al. and Ross et al. in brain tumor xenografts have demonstrated that diffusion measurements increased in response to treatment and that increase in ADC values correlated with a decrease in cellularity.[2537]
The use of ADC values requires an appreciation of how they were derived. For example, Higano et al. measured the minimum preoperative ADC values of 37 patients with glioma who underwent surgery and radiotherapy. After a 2-year follow-up period, correlations were made between minimum ADC and clinical outcomes. Stable patients had significantly higher preoperative ADC values than those who progressed (P < 0.01).[12] By using the minimum ADC value, the effects of necrosis were excluded only when the effects of cellularity were evaluated. Another way of minimizing the effects of necrosis and cyst formation is to use ROI derived from very high b-value (800–1000 s/mm2) images and then to derive ADC values from selected volume elements only.
The method for measuring ADC differs among reported studies, and inconsistent results may reflect the selection of contrast material–enhanced versus nonenhanced ROIs and/or necrotic ROIs within the tumor. Necrotic areas are more common in high-grade gliomas and contribute to high ADCs. In a study that included eight Grade I astrocytic tumors, eight Grade II astrocytic tumors, 12 Grade III astrocytic tumors, and 22 Grade IV astrocytic tumors a significant difference between the ADC values was reported.[38]
Moffat et al. evaluated patients with brain tumors before and 3 weeks into a 7-week course of radical radiotherapy.[26] Changes in ADC values were significantly correlated with both time to progression and median survival. The prognosis was better in those patients who had an increase in ADC values. Further increases in water diffusion are attributable to treatment-induced necrosis. They concluded that changes in water diffusion might be seen before changes in tumor volume and, thus, ADC can act as an early biomarker of therapy response.
Patients with LGG [Figure 4], anaplastic ODG [Figure 5] and GBM [Figure 6] provided the temporal profile of “minimum ADC” values that mirror the clinical response of the patients. The upward trend of increasing “minimum ADC” suggested the well-being clinically and radiologically of the LGG while the initial increase followed by the reduction of “minimum ADC” supported the fact that 4 out of 5 anaplastic ODG have progressive disease; whereas the consistent decrease in “minimum ADC” of the GBM patients suggested the worsening of all patients with GBM in spite of RT. Figure 8 provides a case history of the patient with anaplastic ODG who had apparently stable radiological findings but was clinically worse, and the “minimum ADC “ of his tumor showed increasing cellularity, that is, repopulation by possibly malignant cells.
The biophysical mechanisms that cause reductions in ADC values, once therapy is begun are not fully understood. Lower ADC values (i.e., more restricted diffusion) could occur as a result of cellular swelling, with a concomitant reduction and increased tortuosity of the extracellular space. An additional contributing factor is a reduction in blood flow, although preclinical and clinical data have shown that blood flow reduction is not a very early event after most conventional therapies. Cellular swelling has been noted to occur in the early phases of apoptosis in response to anti-neoplastic treatment. Tissue compaction and fibrosis after successful therapy can also cause reductions in ADC values, but these events occur late in the course of therapy. Mardor et al. performed a study in three patients with brain tumors who received convection-enhanced taxol chemotherapy (i.e., pulsed delivery of chemotherapy via an intratumoral catheter). Falling ADC values were associated with subsequent treatment responses and temporal changes in ADC in response to therapy were observed.[24] Some other studies also have discussed DW-MRI and ADC values as cancer biomarker recently highlighting the potential of this promising technique in cancer patients.[39404142]
After successful therapy, removal of dead and/or dying cells is followed by tissue compaction, fibrosis, and regeneration of native tissues. These processes can result in a decrease in “minimum ADC” values from the higher “minimum ADC” values which were due to decreased cellularity. In addition, the presence of residual active disease or repopulation by resistant cells can also decrease the “minimum ADC” values. Therefore, other imaging techniques, such Methionine PET (MET-PET CT) scanning or perfusion imaging may be needed to make such a distinction. Fibrosis is associated with reduced enhancement on perfusion imaging and low MET uptake on PET-CT scans, whereas residual active disease causes marked enhancement on Perfusion imaging and high MET uptake on PET-CT scans.
MET-PET CT is quite expensive method and the differentiation between residual tumor and inflammation is often quite difficult. Furthermore, radiation exposure is a drawback mainly in younger patients undergoing several follow-up studies for response assessment. MR spectroscopy is a very promising method; however, 'it's limitations include low spatial resolution, restricted availability and lack of expertise of many radiologists. Perfusion imaging provides information on changes in vascularization of the tumor during treatment; however, image analysis is relatively complicated and therefore not suited for daily clinical routine. Furthermore, the risk of nephrogenic systemic fibrosis – although being very small – has to be taken into account in patients with renal insufficiency.
Pseudoprogression is a transient, self-resolving increase in enhancement mediated by the chemotherapeutic agent, temozolomide. Pseudoresponse is a regression in enhancement mediated by the antiangiogenic chemotherapeutic agent, bevacizumab.[43] However, in our study patients, none of the patients received temozolomide or antiangiogenic agent due to logistic reasons, so we did not see any pseudoprogression or pseudoresponse phenomenon.
Despite the advent of advanced imaging techniques such as MET- PET CT, perfusion MRI, and MR spectroscopy, most places still rely on routine, conventional imaging. As of our understanding, the reason behind this is tough post processing and involvement of extra cost. Our study shows that DWI-derived minimum ADC values correlate well with the cellularity and tumor grade. Minimum ADC values, being relatively easy to acquire and analyze, should be used extensively for predicting treatment response and disease progression which in turn can result in early interventional measures. We need a clinical trial with a large number of patients to formalize a standard protocol for data acquisition, analysis, and interpretation of DWI-derived ADC values.
Limitation
The limitation of our study is being an exploratory study with small sample size and from a single center in India. This may reduce it's generalization.
CONCLUSIONS
Due to the lack of widespread availability of advanced imaging tools such as MET-PET CT and less usage of Perfusion MRI and MR spectroscopy in India and developing part of the world, the DWI-derived ADC is an important yet simple quantitative tool to assess treatment response and disease progression. It should be used extensively to increase the diagnostic confidence leading to better management of patients with glial tumors.
Financial support and sponsorship
Nil.
Conflicts of interest
There are no conflicts of interest.
REFERENCES
- Epidemiology of Brain tumors, incidence, survival and risk factors. In: Roger EM, Marc KR, Darell DB, eds. Russell and Rubinsteins Pathology of Tumors of the Central Nervous System (7th ed). USA: Springer Link; 2006. p. :7-10.
- [Google Scholar]
- Consolidated Report of Hospital Based Registries 2004-2006. National Cancer Registry Programme, Indian Council for Medical Research, Bangalore, India 2009:54.
- [Google Scholar]
- The nature of gliomas as revealed by animal experimentation. Am J Pathol. 1955;31:1-29.
- [Google Scholar]
- Poor-prognosis high-grade gliomas: Evolving an evidence-based standard of care. Lancet Oncol. 2002;3:557-64.
- [Google Scholar]
- Effects of radiation therapy on the human normal brain (white matter) visualized by MR imaging. Magn Reson Imaging. 1991;9:959-61.
- [Google Scholar]
- Promises and controversies in the management of low-grade glioma. Ann Oncol. 2003;14:1695-6.
- [Google Scholar]
- Lymphomas and high-grade astrocytomas: Comparison of water diffusibility and histologic characteristics. Radiology. 2002;224:177-83.
- [Google Scholar]
- Usefulness of diffusion-weighted MRI with echo-planar technique in the evaluation of cellularity in gliomas. J Magn Reson Imaging. 1999;9:53-60.
- [Google Scholar]
- Malignant astrocytic tumors: Clinical importance of apparent diffusion coefficient in prediction of grade and prognosis. Radiology. 2006;241:839-46.
- [Google Scholar]
- Diffusion-weighted imaging-based probabilistic segmentation of high- and low-proliferative areas in high-grade gliomas. Cancer Imaging. 2012;12:89-99.
- [Google Scholar]
- Evaluation of liver diffusion isotropy and characterization of focal hepatic lesions with two single-shot echo-planar MR imaging sequences: Prospective study in 66 patients. Radiology. 2003;226:71-8.
- [Google Scholar]
- Breath-hold T2-weighted MRI of hepatic tumors: Value of echo planar imaging with diffusion-sensitizing gradient. J Comput Assist Tomogr. 1998;22:364-71.
- [Google Scholar]
- Differentiation of noncancerous tissue and cancer lesions by apparent diffusion coefficient values in transition and peripheral zones of the prostate. J Magn Reson Imaging. 2005;21:258-62.
- [Google Scholar]
- High-b value diffusion-weighted MRI for detecting pancreatic adenocarcinoma: Preliminary results. AJR Am J Roentgenol. 2007;188:409-14.
- [Google Scholar]
- Usefulness of the calculated apparent diffusion coefficient value in the differential diagnosis of retroperitoneal masses. J Magn Reson Imaging. 2004;20:735-42.
- [Google Scholar]
- Magnetic resonance diffusion imaging of ovarian masses: A first experience with 12 cases. MAGMA. 2004;16:182-93.
- [Google Scholar]
- Diffusion-weighted imaging of breast cancer with the sensitivity encoding technique: Analysis of the apparent diffusion coefficient value. Magn Reson Med Sci. 2004;3:79-85.
- [Google Scholar]
- MR microimaging of benign and malignant nodes in the neck. AJR Am J Roentgenol. 2006;186:749-57.
- [Google Scholar]
- ADC values and prognosis of malignant astrocytomas: Does lower ADC predict a worse prognosis independent of grade of tumor? a meta-analysis. AJR Am J Roentgenol. 2013;200:624-9.
- [Google Scholar]
- Prospective randomized trial of low- versus high-dose radiation therapy in adults with supratentorial low-grade glioma: Initial report of a North Central Cancer Treatment Group/Radiation Therapy Oncology Group/Eastern Cooperative Oncology Group study. J Clin Oncol. 2002;20:2267-76.
- [Google Scholar]
- Monitoring response to convection-enhanced taxol delivery in brain tumor patients using diffusion-weighted magnetic resonance imaging. Cancer Res. 2001;61:4971-3.
- [Google Scholar]
- Diffusion magnetic resonance imaging: An early surrogate marker of therapeutic efficacy in brain tumors. J Natl Cancer Inst. 2000;92:2029-36.
- [Google Scholar]
- Functional diffusion map: A noninvasive MRI biomarker for early stratification of clinical brain tumor response. Proc Natl Acad Sci U S A. 2005;102:5524-9.
- [Google Scholar]
- Functional magnetic resonance imaging in cervical cancer: Current evidence and future directions. J Cancer Res Ther. 2012;8:11-8.
- [Google Scholar]
- Diffusion-weighted imaging of gynecologic tumors: Diagnostic pearls and potential pitfalls. Radiographics. 2014;34:1393-416.
- [Google Scholar]
- Current role of magnetic resonance imaging in evaluation and radiotherapy in locally advanced carcinoma cervix. Indian J Gynecol Oncol. 2016;14:34.
- [Google Scholar]
- Post-treatment imaging of high-grade gliomas. Indian J Radiol Imaging. 2015;25:102-8.
- [Google Scholar]
- Adverse effects of brain irradiation correlated with MR and CT imaging. Int J Radiat Oncol Biol Phys. 1988;15:319-30.
- [Google Scholar]
- Updated response assessment criteria for high-grade gliomas: Response assessment in neuro-oncology working group. J Clin Oncol. 2010;28:1963-72.
- [Google Scholar]
- Image J for microscopy. 2007. Biotechniques. 43:25-30. Available from: https://imagej.nih.gov/ij/
- [Google Scholar]
- Apparent diffusion coefficient and cerebral blood volume in brain gliomas: Relation to tumor cell density and tumor microvessel density based on stereotactic biopsies. AJNR Am J Neuroradiol. 2008;29:476-82.
- [Google Scholar]
- Evaluation of cancer therapy using diffusion magnetic resonance imaging. Mol Cancer Ther. 2003;2:581-7.
- [Google Scholar]
- Grading astrocytic tumors by using apparent diffusion coefficient parameters: Superiority of a one- versus two-parameter pilot method. Radiology. 2009;251:838-45.
- [Google Scholar]
- Diffusion-weighted MRI as a biomarker for treatment response in glioma. CNS Oncol. 2012;1:169-80.
- [Google Scholar]
- Predicting and monitoring cancer treatment response with diffusion-weighted MRI. J Magn Reson Imaging. 2010;32:2-16.
- [Google Scholar]
- Diffusion-weighted magnetic resonance imaging as a cancer biomarker: Consensus and recommendations. Neoplasia. 2009;11:102-25.
- [Google Scholar]
- Functional diffusion map as an early imaging biomarker for high-grade glioma: Correlation with conventional radiologic response and overall survival. J Clin Oncol. 2008;26:3387-94.
- [Google Scholar]
- Pseudoprogression and pseudoresponse: Imaging challenges in the assessment of posttreatment glioma. AJNR Am J Neuroradiol. 2011;32:1978-85.
- [Google Scholar]